Packed with rankings, interactive player profiles, proprietary passing and accuracy metrics, situational breakdowns and much more, the QB Annual is built to help you evaluate every qualifying quarterback from every angle.
Here's a breakdown of each section.
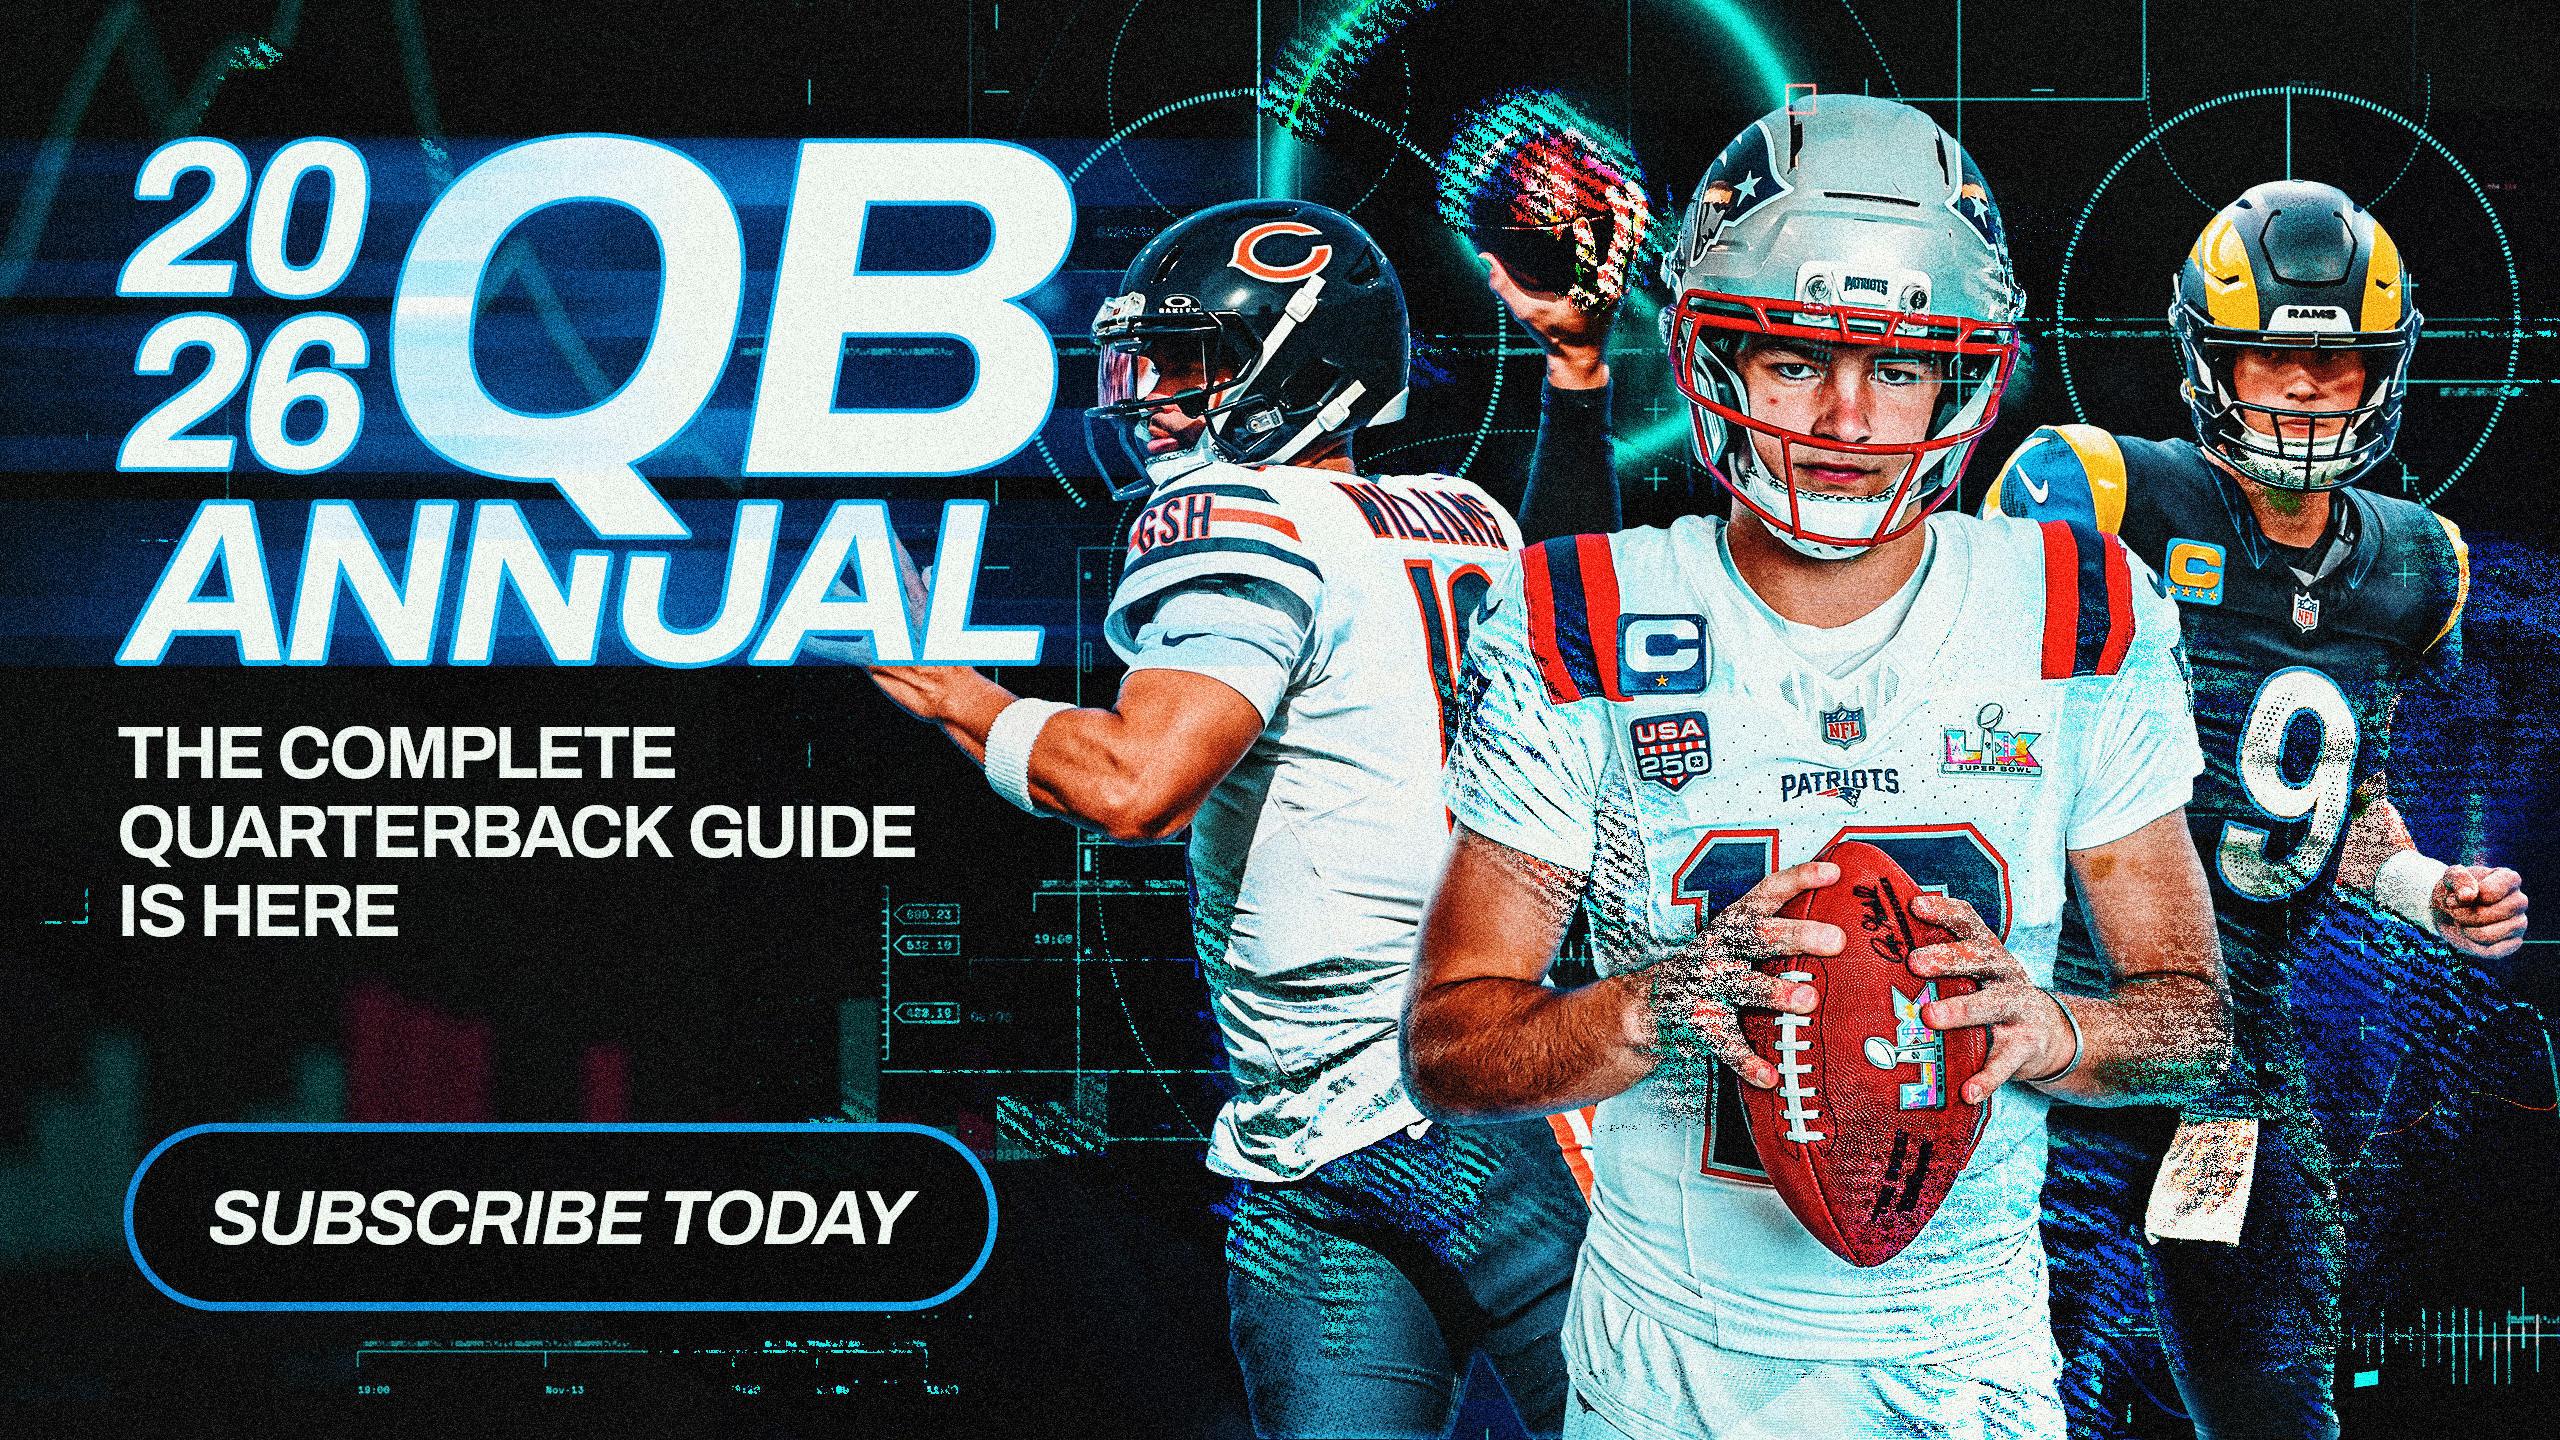
The QB Annual Is LiveEvery qualifying quarterback. Every metric that matters. PFF grades, passing splits, EPA per dropback, clutch performance, interception luck and more — all in one interactive guide built on the same data trusted by all 32 NFL teams.
Read the QB Annual (opens in new tab)Get PFF+ (opens in new tab)The 2025 season at a glance
Before diving into individual quarterback profiles, the annual opens with leaderboards highlighting the top five quarterbacks across PFF's most important and insightful metrics. It's the quickest way to see which passers led the NFL in everything from overall grade to accuracy, big-time throw rate, turnover-worthy play rate and beyond.
43 individual quarterback profiles
Every qualifying quarterback receives a dedicated interactive profile spanning 18 sections. It begins with a season overview featuring box-score stats and PFF grade before expanding into three-year grade and WAR trends, EPA relative to the league average, weekly game grades, play-level grade distributions and interactive visualizations that bring every aspect of a quarterback's season to life.
Grading profiles and zero-graded throw production
Two interactive scatterplots place every qualifying quarterback on the same canvas. The first charts big-time throw rate against turnover-worthy play rate, providing a clear visual of each quarterback's risk-reward profile. The second plot shows positively graded play rate against negatively graded play rate, illustrating whether a quarterback's performance was driven by positive plays, avoiding mistakes or a combination of both.
Zero-graded throw production adds another layer of context. Because a zero-grade represents an expected NFL throw — one executed correctly without significantly helping or hurting the offense — tracking yards per attempt and EPA per attempt on those plays helps quantify how much production a quarterback generates when simply executing the offense as designed.
Grades by throw type and situation
A five-tab carousel breaks down PFF passing grades across some of the most important context points in quarterback evaluation. The Situations tab covers performance under pressure, against the blitz, on screens and play action, by time in the pocket, by quarterback alignment, by safety shell and by down-and-distance. Throw Type separates passing grade by specific throw categories, from vertical leads and horizontal leads to the full range of quarterback throw types charted by PFF.
Reads shows how quarterbacks performed when throwing to their first read, second read or checkdown, while Coverage measures passing grades against every major defensive structure, from man coverage to single-high, two-high and zone concepts. Target Alignment breaks down performance by where receivers lined up at the snap.
Every tab includes PFF passing grade, attempt volume and rank among qualifying passers.
Accuracy breakdown
PFF's proprietary accuracy charting goes far beyond completion percentage, breaking ball placement down into two complementary views.
The Ball Placement tab centers on perfectly placed passes — throws charted by PFF as delivered with optimal accuracy, allowing receivers to catch the ball in stride and maximize yards after the catch. The Why Throws Missed tab categorizes every incompletion by its underlying cause, distinguishing quarterback-driven misses — such as overthrows, underthrows and poor ball placement — from incompletions created by receiver error, defensive pass breakups and other external factors.
Stable and Unstable Metrics
Not every quarterback metric is equally predictive. This section separates highly repeatable metrics —those that best reflect a quarterback's underlying skill — from those that fluctuate more from season to season because of situation, variance or other external factors.
Every metric is displayed as a percentile bar, making it easy to identify a quarterback's sustainable strengths and distinguish them from production that's less likely to carry over.
Situational splits
A five-tab carousel compares quarterback performance across some of the game's most important contextual splits: clean pocket versus pressure, blitz versus no blitz, play action versus standard dropbacks, screen versus non-screen passes and throws delivered in under or over 2.5 seconds.
Each comparison includes PFF passing grade, completion rate, yards per attempt, big-time throw rate, turnover-worthy play rate, sack rate and the performance delta between the two splits, making it easy to identify the environments in which each quarterback thrives or struggles.
ALLOWED PRESSURES
This section answers one simple question: Who was responsible for the pressure? Every pressure is attributed to its source — each offensive line position, the tight end, the quarterback or another factor — alongside totals for pressures, sacks, hits and hurries.
The quarterback fault metric is especially revealing, showing how often a passer created pressure himself rather than being let down by the protection.
RUSHING
Every qualifying quarterback receives a dedicated rushing profile covering every aspect of his production as a runner. Alongside rushing grade and traditional statistics, the section separates designed runs from scrambles while highlighting elusiveness, yards after contact, missed tackles forced and explosive rushing ability.
INTERCEPTION LUCK
Interceptions are one of the NFL's noisiest statistics, and this section separates skill from luck. Using PFF's play-level data, the model estimates how many interceptions a quarterback should have thrown based on the quality of his decisions, then compares that figure with his actual total. The result highlights dropped interceptions, interceptions on non-turnover-worthy throws and a net luck figure, helping distinguish quarterbacks who benefited from fortune from those whose interception totals were inflated by bad luck.
TARGET MAPS
Four visualization tools provide different perspectives on where and how quarterbacks attacked the field. The Target Depth Map breaks down production by field location, the Accuracy Depth shows ball placement across every area of the field, and the Route Tree organizes passing performance by route type, making it easy to identify which concepts each quarterback executed most effectively.
The Interactive Target Map plots every aimed throw from the season on a searchable field. Clicking any pass reveals a complete play breakdown, including down-and-distance, coverage shell, target and primary coverage defender, ball placement, result and additional proprietary charting data, allowing users to explore every throw in detail.
CLUTCH MOMENTS
The final section focuses on the moments that define games, isolating fourth-quarter, close-game situations to evaluate how quarterbacks performed when the pressure was highest. Every qualifying passer with enough clutch dropbacks is ranked across eight key metrics — including PFF passing grade, yards per attempt, big-time throw rate, turnover-worthy play rate, accuracy rate and pressure-to-sack rate — providing a direct league-wide comparison of who elevated their play when the game was on the line.
Built for PFF+
The 2026 PFF QB Annual is available exclusively to PFF+ subscribers. Every section, every metric and every interactive feature is included.
Subscribe to PFF+ to unlock the full annual, or view the annual directly if you're already a subscriber.